


 10 minutes
 Share
ShareBollinger Bands are an indicator for technical market analysis, developed by John Bollinger in the 1980s. The main goal of the indicator is to alert traders of a potential price change or stability trend. This helps determine whether prices are relatively high or low at any given time.
You might see something like this:
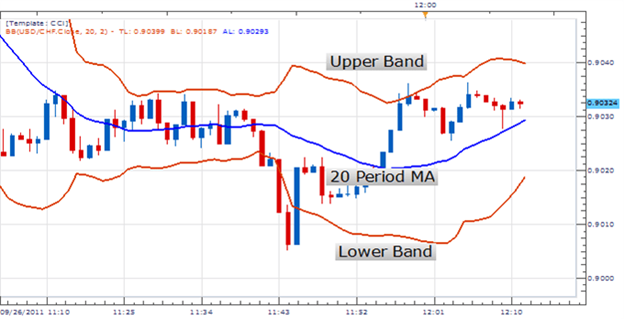
- The blue line labeled “20 Period MA” is a moving arithmetical average. This means that the price is determined from the average of the past 20 prices, which is the Simple Moving Average (SMA). You can also indicate Exponential Moving Average (EMA) and Weighted Moving Average (WMA) instead of Simple Moving Average (SMA) in the bot settings.
Detailed information on the formulas can be seen here. - The upper red band is the SMA plus two standard deviations.
- The lower red band is the SMA minus two standard deviations.
Volatility and stability
The upper and lower red bands expand during periods of volatility and contract during price stability. The idea is that you can see these stability periods in contrast to when the price goes over or under one of the bands, indicating to the trader a breakthrough event.
To buy or to sell... that is the question!
If the price goes under the lower band, it means that price is dropping and it is a good time to buy. If the price goes over the upper band, then the price is rising and it is better to sell.
