


 10 minutes
 Share
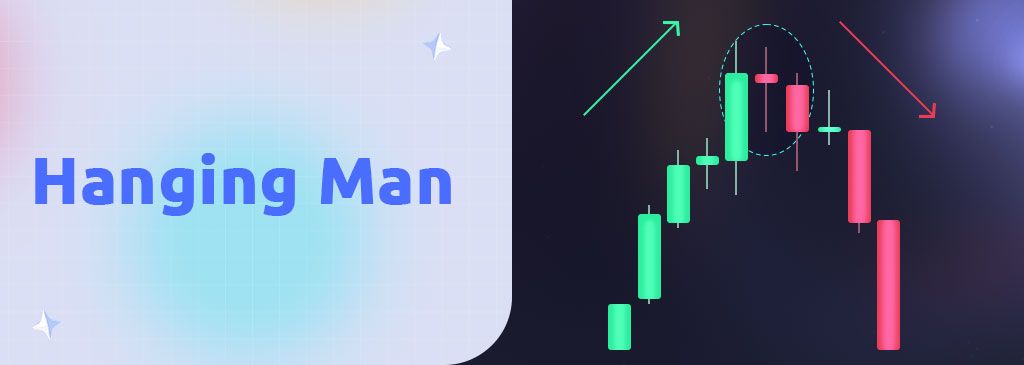
ShareRecognize the Hanging Man
Prices are going up, up, up, and suddenly you see a short red candle with a long lower shadow. This is the classic Hanging Man and is a pattern that often comes before a price drop. When this signal appears it means a significant amount of selling happened early in the period, but ended with a buying push to recover the price closer to the opening.
Should I sell?
When you see this candlestick pattern, the next few periods will either confirm the downtrend, or buyers will recover the price and push it back up. Thus, this signal is only a warning that bulls lost control of the market during that period. If you are looking to exit a long position, this might be your sign to sell, but it could also portend much lower prices to come, thus a better strategy might be to wait and buy at a much lower price.
Using signals
As with all trading signals, they do not guarantee anything will happen next. They only suggest the mood of the market, and you can only look to historical cycles to see what has previously happened in response. If you choose to buy short based on these signals, consider placing a stop loss order above the high of a hanging man to mitigate risk.